
Insight that matches your responsibility
The practice manager follows staffing and progress. The clinician reviews the daily work and the treatment outcomes. Their overviews use data from the same system.
Per role
A surgeon looks at other things than a manager
A surgeon needs different figures from a practice manager, and an optometrist looks at his day, not at revenue. The dashboard therefore differs per role.
Anyone who wants something else adjusts it for themselves, without it changing for the rest. It can be set up at organisation, role and person level.
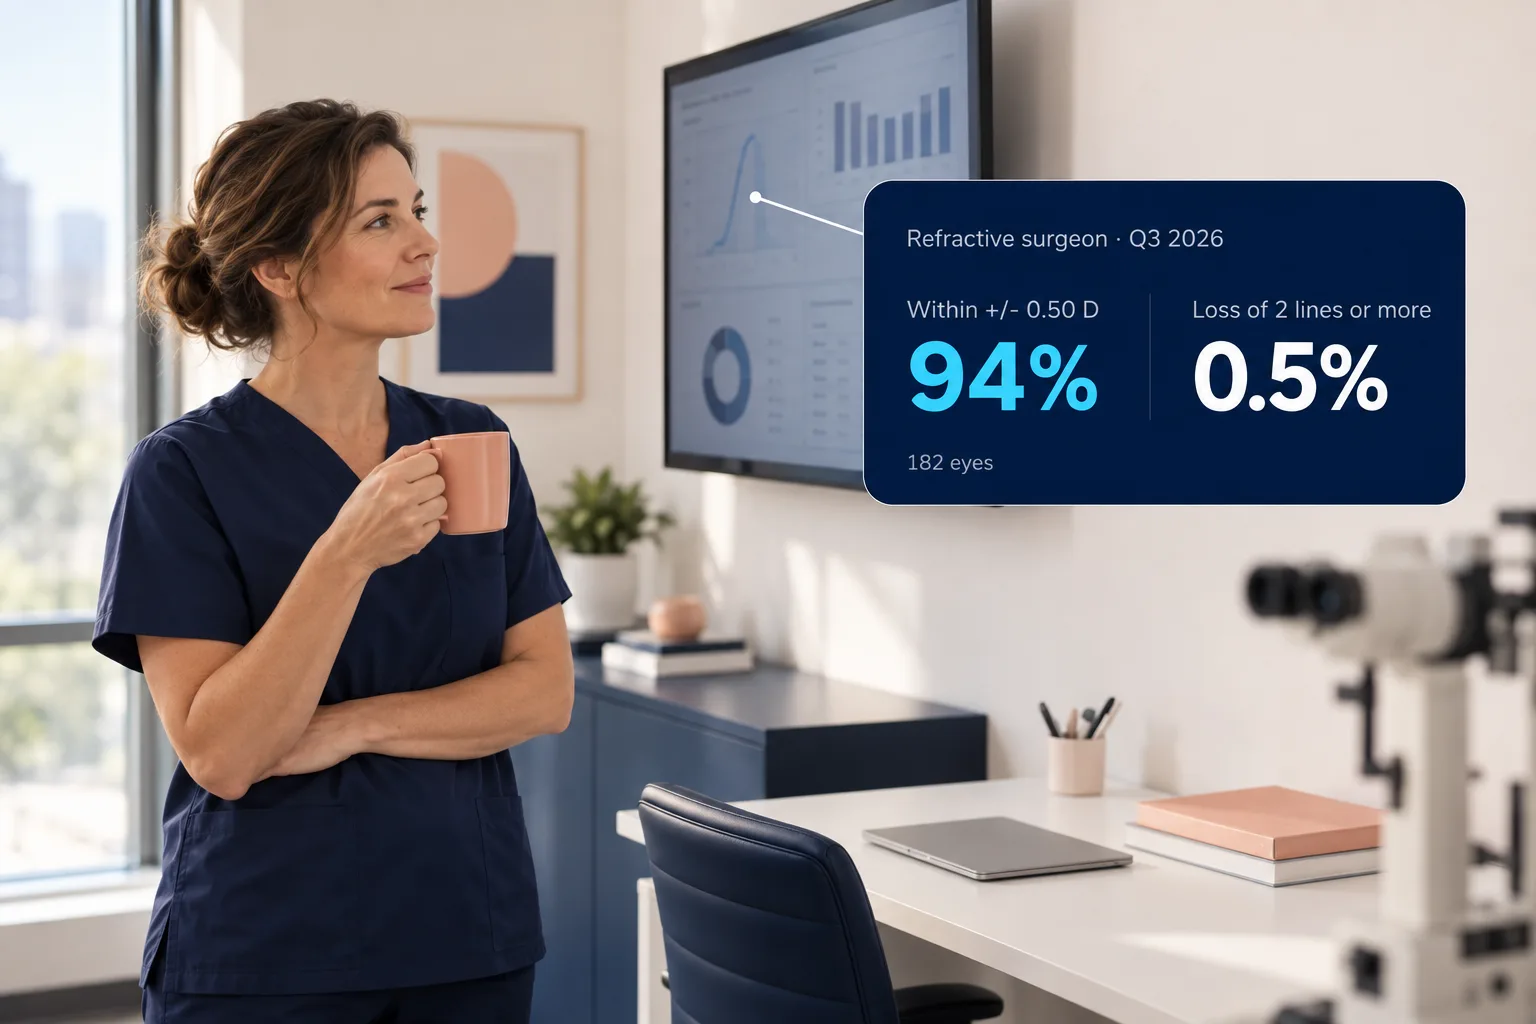
The surgeon can follow her own treatment outcomes.
Five overviews, one source
Refractive surgeon
Treatment outcomes per technique, with graphs for predictability and safety, among other things.
Vitreoretinal surgeon
Outcomes of retinal surgery, including recovery, recurrences and repeat operations, broken down by procedure and period.
Optometrist
Today’s consultations, open tasks and examinations that are not yet complete.
Ophthalmic technician
Today’s measurement lane: which examinations are queued, which devices are next, what is still missing.
Practice manager
Staffing, revenue, missed appointments and the number of proposals that lead to a treatment, per location.
The figures come from the work itself.
Use the recorded measurements from follow-up visits to track treatment outcomes.
Which figures do you produce by hand today?
Bring that report to the demo. We will show what aēyes takes from the work itself.